This article is a shortened version of a post from the Wallaroo Blog, originally written by Julio Barros and me. I'm posting the non-Wallaroo section of that article here, with permission, because I think it's a useful reference for A/B testing---one that I refer to myself. Hopefully, others find it helpful as well.
How to A/B Test Machine Learning Models #
A/B tests are a key tool of business decision-making. In this article, we'll discuss the what and why of A/B testing, and how an A/B test is designed.
What is an A/B Test? #
An A/B test, also called a controlled experiment or a randomized control trial, is a statistical method of determining which of a set of variants is the best. A/B tests allow organizations and policy-makers to make smarter, data-driven decisions that are less dependent on guesswork.
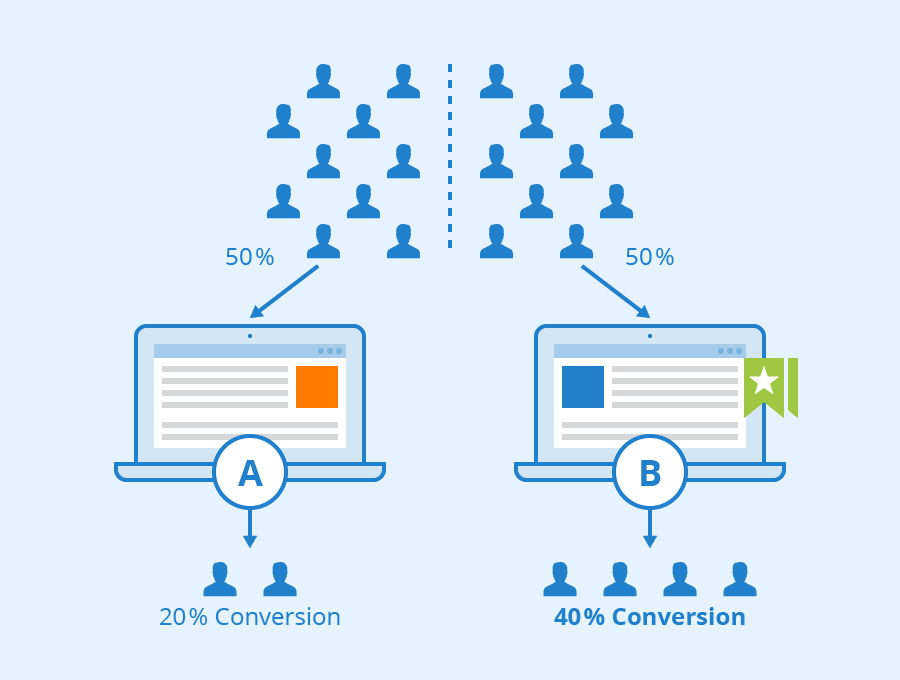
In the simplest version of an A/B test, subjects are randomly assigned to either the control group (group A) or the treatment group (group B). Subjects in the treatment group receive the treatment (such as a new medicine, a special offer, or a new web page design) while the control group proceeds as normal without the treatment. Data is then collected on the outcomes and used to study the effects of the treatment.
Author: Seobility - License: [CC BY-SA 4.0]( "Creative Commons License BY-SA 4.0")
A/B Testing in History #
This idea has been around for a long time. Historically, farmers have divided their fields into sections to test whether various treatments can improve their crop yield. Something like an A/B nutrition test even appears in the Old Testament!
“Please test your servants for ten days. Let us be given vegetables to eat and water to drink. You can then compare our appearance with the appearance of the young men who eat the royal rations…" (Daniel 1:12-13)
In 1747, Dr. James Lind conducted one of the earliest clinical trials, testing the efficacy of citrus fruit for curing scurvy.
A/B Testing Today #
Today, A/B tests are an important business tool, used to make decisions in areas like product pricing, website design, marketing campaign design, and brand messaging. A/B testing lets organizations quickly experiment and iterate in order to continually improve their business.
In data science, A/B tests can also be used to choose between two models in production, by measuring which model performs better in the real world. In this formulation, the control is often an existing model that is currently in production, sometimes called the champion. The treatment is a new model being considered to replace the old one. This new model is sometimes called the challenger. In our discussion, we'll use the terms champion and challenger, rather than control and treatment.
Keep in mind that in machine learning, the terms experiments and trials also often refer to the process of finding a training configuration that works best for the problem at hand (this is sometimes called hyperparameter optimization). In this article, we will use the term experiment to refer to the use of A/B tests to compare the performance of different models in production.
How to Design an A/B Test #
A/B tests are a useful way to rely less on opinions and intuition and to be more data-driven in decision making, but there are a few principles to keep in mind. The experimenter has to decide on a number of things.
First, decide what you are trying to measure. We'll call this the Overall Evaluation Criterion or OEC. This may be different and more business-focused than the loss function used while training the models, but it must be something you can measure. Common examples are revenue, click-thru rate, conversion rate, or process completion rate.
Second, decide how much better is "better". You might want to just say "Success is when the challenger is better than the champion," but that's actually not a testable question, at least not in the statistical sense. You have to decide how much better the challenger has to be. Let's define two quantities:
-
y0: The champion's assumed OEC. Since the champion has been running for a while, we should have a good idea of this value. For example, if we are measuring conversion rate, then we might already know that the champion typically achieves a conversion rate of y0 = 2%.
-
𝞭: the minimum delta effect size we want to reliably detect. This is how much better the challenger needs to be for us to declare it "the winner." For example, we may decide to switch to our challenger model if it improves the conversion rate by at least 1% – that is, we want the challenger to have a conversion rate of at least 0.02 * (1.01) = 0.0202. This means 𝞭 = 0.002.
Note that some sample size calculators (we'll get to that below) specify minimum effect size as a relative delta; in our example, the relative delta is 0.01 (1%), and the absolute delta is 0.002.
Third, decide how much error you want to tolerate. Again, you probably want to say "none," but that isn't practical. The less error you can tolerate, the more data you need, and in an online setting, the longer you have to run the test. In the classical statistics formulation, an A/B test has the following parameters to describe the error:
-
𝞪: the significance, or false positive rate that we are willing to tolerate. Ideally, we want 𝞪 as small as possible; in practice, 𝞪 is usually set to 0.05. You can think of this as meaning that if we run an A/B test over and over again, we will incorrectly pick an inferior challenger 5% of the time.
-
𝞫: the power, or true positive rate we want to achieve. Ideally, we would like 𝞫 near 1; in practice, 𝞫 is usually set to 0.8. You can think of this as meaning that if we run an A/B test over and over again we will correctly pick a superior challenger 80% of the time.
Note that 𝞪 and 𝞫 are talking about incompatible circumstances (that's why they don't add up to 1). The first case assumes the challenger is worse, the other case assumes it's better; finding out which situation we are in is the whole point of an A/B test.
There's one last parameter in an A/B test:
- n: the minimum number of examples (per model) we have to examine to make sure our false positive rate 𝞪 and true positive rate 𝞫 thresholds are met. Or as it's commonly said: "to make sure we achieve statistical significance."
Note that n is per model: so if you are routing your customers between A and B with a 50-50 split, you need a total experiment size of 2n customers. If you are routing 90% of your traffic to A and 10% to B, then B has to see at least n customers (and A will then see around 9n). So a 50-50 split is the most efficient, although you may prefer an unbalanced split for other reasons, like safety or stability.
To run an A/B test, the experimenter picks 𝞪, 𝞫, and the minimum effect size 𝞭, and then determines n. We won't go into the formula for calculating n here; so-called power calculators or sample-size calculators exist to do that for you. Here's one for rates, from Statsig; it defaults to 𝞪 = 0.05, 𝞫 = 0.8, and split ratio of 50-50. Feel free to play around to get a sense of how big sample sizes have to be in different situations.
Once you've run the A/B test long enough to achieve the necessary n, measure the OEC for each model. If OECchallenger - OECchampion > 𝞭, then the challenger wins! Otherwise, you may wish to stick with the champion model.
Some Practical Considerations #
Splitting your subjects: When splitting your subjects up randomly between models, make sure the process is truly random, and think through any interference between the two groups. Do they communicate or influence each other in some way? Does the randomization method cause an unintended bias? Any bias in group assignments can invalidate the results. Also, make sure the assignment is consistent so that each subject always gets the same treatment. For example, a specific customer should not get different prices every time they reload the pricing page.
A/A Tests: It can be a good idea to run an A/A test, where both groups are control or treatment groups. This can help surface unintentional biases or errors in the processing and can give a better feeling for how random variations can affect intermediate results.
Don't Peek!: Due to human nature, it's difficult not to peek at the results early and draw conclusions or stop the experiment before the minimum sample size is reached. Resist the temptation. Sometimes the "wrong" model can get lucky for a while. You want to run a test long enough to be confident that the behavior you see is really representative and not just a weird fluke.
The more sensitive a test is, the longer it will take: The resolution of an A/B test (how small a delta effect size you can detect) increases as the square of the samples. In other words, if you want to halve the delta effect size you can detect, you have to quadruple your sample size.
Extensions to A/B Testing #
Bayesian A/B Tests
The classical (AKA frequentist) statistical approach to A/B testing that we described above can be a bit unintuitive for some people. In particular, note that the definitions of 𝞪 and 𝞫 posit that we run the A/B test over and over; in actuality, we generally run it only once (for a specific A and B). The Bayesian approach takes the data from a single run as a given, and asks, "What OEC values are consistent with what I've observed?"
The general steps for a Bayesian analysis are roughly:
-
Specify prior beliefs about possible values of the OEC for the experiment groups. An example prior might be that conversion rates for both groups are different and both between 0 and 10%.
-
Define a statistical model using a Bayesian analysis tool (ie. using distributional techniques) and flat, uninformative, or equal priors for each group.
-
Collect data and update the beliefs on possible values for the OEC parameters as you go. The distributions of possible OEC parameters start out encompassing a wide range of possible values, and as the experiment continues the distributions tend to narrow and separate (if there is a difference).
-
Continue the experiment as long as it seems valuable to refine the estimates of the OEC. From the posterior distributions of the effect sizes, it is possible to estimate the delta effect size.
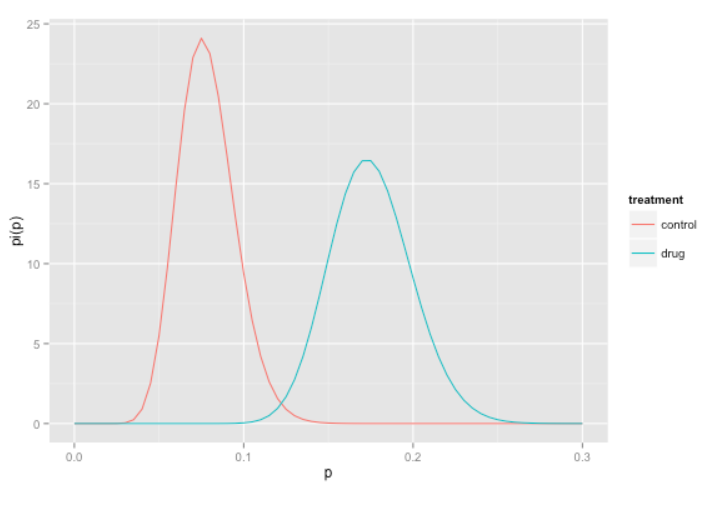
Posterior distributions of a Bayesian treatment/control test. Source: Win-Vector Blog
Note that a Bayesian approach to A/B testing does not necessarily make the test any shorter; it simply makes quantifying the uncertainties in the experiment more straightforward, and arguably more intuitive. For a worked example of frequentist and Bayesian approaches to treatment/control experiments (in the context of clinical trials), see this blog post from Win Vector LLC.
Multi-Armed Bandits #
If you want to minimize the waiting until the end of an experiment before taking action, consider Multi-Armed Bandit approaches. Multi-armed bandits dynamically adjust the percentage of new requests that go to each option, based on that option's past performance. Essentially, the better performing a model is, the more traffic it gets—but some small amount of traffic still goes to poorly performing models, so the experiment can still collect information about them. This balances the trade-off between exploitation (extracting maximal value by using models that appear to be the best) and exploration (collecting information about other models, in case they turn out to be better than they currently appear). If a multi-armed bandit experiment is run long enough, it will eventually converge to the best model, if one exists.
Multi-armed bandit tests can be useful if you can't run a test long enough to achieve statistical significance; ironically, this situation often occurs when the delta effect size is small, so even if you pick the wrong model, you don't lose much. In fact, the exploitation-exploration tradeoff means that you potentially gain more value during the experiment than you would have running a standard A/B test.